India wins another Test and wraps up another series with a series score line of 3-1, That score line made me wonder as to how fortunate we are today to be watching Test matches which actually produce a result. This was really not the case when I was a kid with many tests ending in a stalemate. A draw, back then was considered to be an acceptable result and in many cases also treated on par with a victory. Those were the days when neither sporting declarations nor spirited chases were in vogue. A Test match on the 5th day would typically meander meaninglessly allowing those playing to get to some personal milestones and thankfully end before the scheduled close with the customary handshakes of opposing teams. That's probably the reason why I don't remember too many drawn test matches from that era.
The only memorable draw that comes to my mind was the one in Sydney where Vihari and Ashwin stalled Australia's charge. Since a draw has become somewhat of a rarity these days, I wanted to analyze stats related to drawn Test matches over the decades. With more and more captains around the world pushing for a result and with the introduction of World Test Championship, I sensed that draws were losing their sheen but boy was I glad when numbers corroborated my initial hypothesis.
What are the overall numbers telling us?
- 31% (788) of the 2531 Test matches in the entire history of cricket have ended in a draw
- Prior to 1950, 98 (31%) out of 319 Test matches ended up as draws
- That percentage was maintained in the 50s and then came the 60s where draws for all intensive purposes were treated on par with wins. Draws constituted 47% of the matches played in that decade
- The draw percentages stayed over the 40% mark until the 90s when Australia's brand of attacking cricket took over
- The percentage of drawn Test matches since then has steadily declined and is now at 15% for the current decade (I am waiting for the time when this number goes down to single digits)
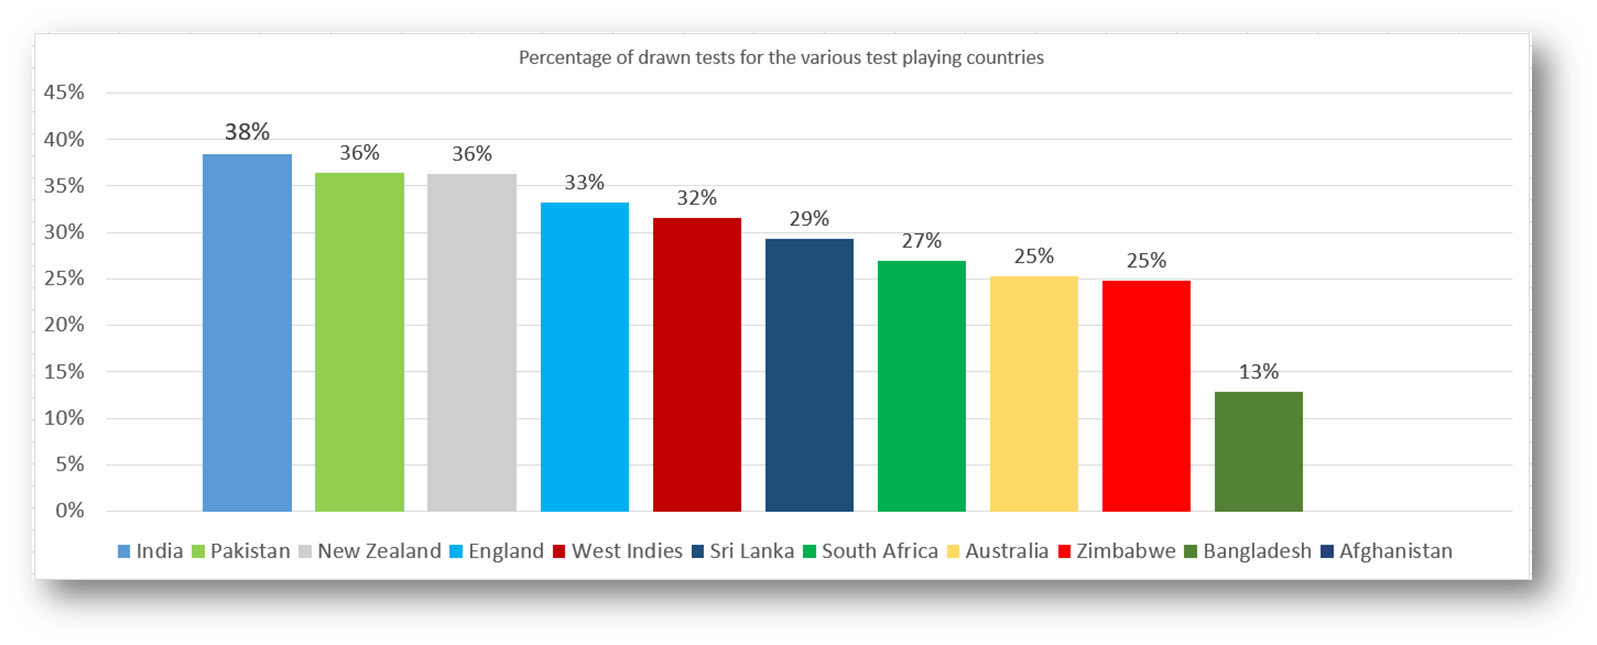
- As is evident from the graph, India with 222 (38%) draws out of a total of 577 Tests played tops the chart. The total number of draws exceed the total number of wins (177) for India thus far. The team is one win away currently from equaling their total losses (178)
- India also contributed 48 out of 122 draws in the 80s. The draw percentage for India has significantly come down since then with only five draws since January 2020
- India and Pakistan (166 draws out of 456 played) are the only countries with more draws than wins or losses
- England has drawn the most number of matches in history with 355 draws out of 1070 played
- Afghanistan is the only test playing country with zero draws so far
- Even at their peak in the 80s, West Indies drew almost 40% (31 out of 82) of the matches they played in that decade


Comments
Post a Comment